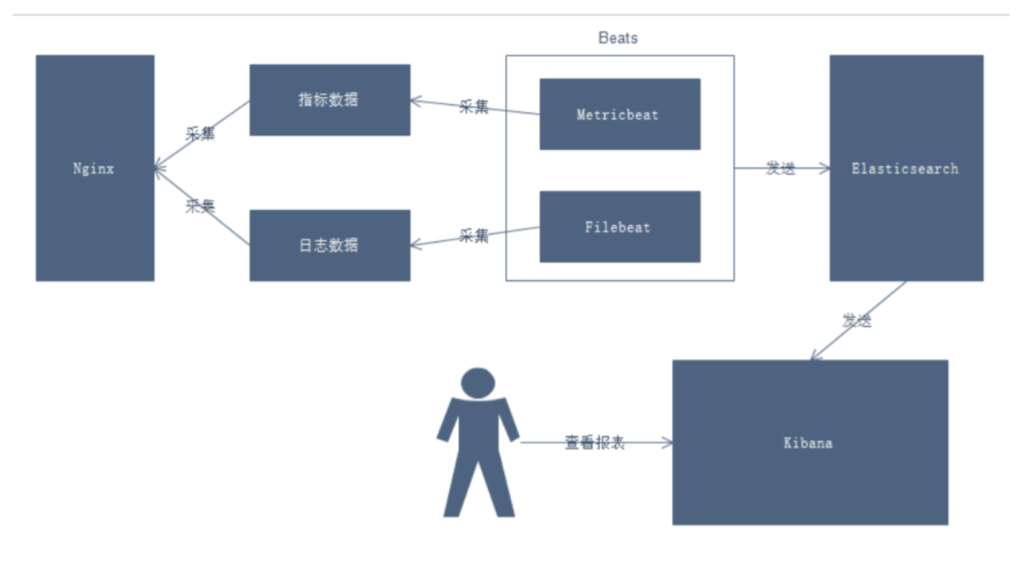
EFK架构介绍
EFK三个开源软件组成,分别是Elasticsearch、FileBeat和Kibana。这三个软件各自在日志管理和数据分析领域发挥着重要作用,它们之间互相配合使用,完美衔接,高效地满足了多种场合的应用需求,是目前主流的一种日志分析系统解决方案。
- Elasticsearch:负责日志的保存和搜索。它是一个分布式、高扩展、高实时的搜索与数据分析引擎,基于Lucene开发,通过RESTful web接口提供全文搜索和分析功能。Elasticsearch能够高效地存储和索引各种类型的数据,并支持快速搜索和实时分析。
- FileBeat:负责日志的收集。它由Elastic公司开发,专为日志收集而设计,具有资源占用低、易于部署的特点。FileBeat直接从服务器上的日志文件读取数据,进行初步的归集和简单处理,然后将其转发到Elasticsearch或其他中间件。ilebeat 是使用 Golang 实现的轻量型日志采集器,也是Elasticsearch stack 里面的一员。本质上是一个 agent ,可以安装在各个节点上,根据配置读取对应位置的日志,并上报到相应的地方去。Filebeat 并不依赖于 ElasticSearch,可以单独存在。我们可以单独使用Filebeat进行日志的上报和搜集。filebeat 内置了常用的 Output 组件, 例如 kafka、ElasticSearch、redis 等,出于调试考虑,也可以输出到 console 和 file。
- Kibana:负责日志数据的界面展示。它是一个开源的数据分析和可视化平台,提供丰富的数据可视化选项,如柱状图、线图、饼图等,帮助用户以图形化的方式理解数据。此外,它还支持强大的数据探索功能,用户可以使用Elasticsearch的查询语言进行数据查询和筛选。
Filebeat安装
在Kibana上可以看到Filebeat有Macos,DEB,RPM,Windows版本。
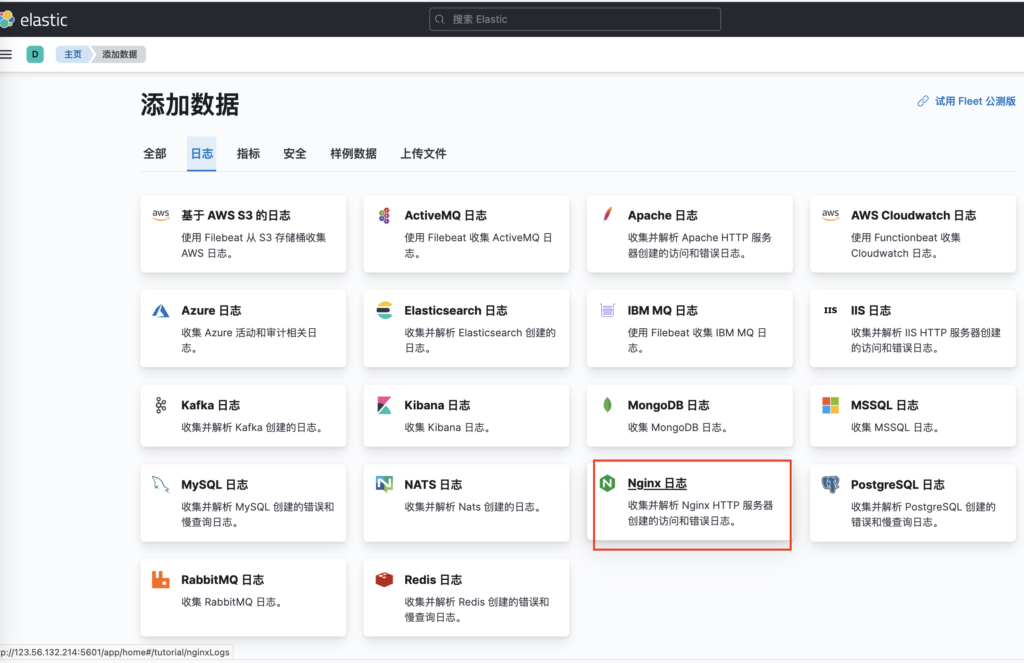
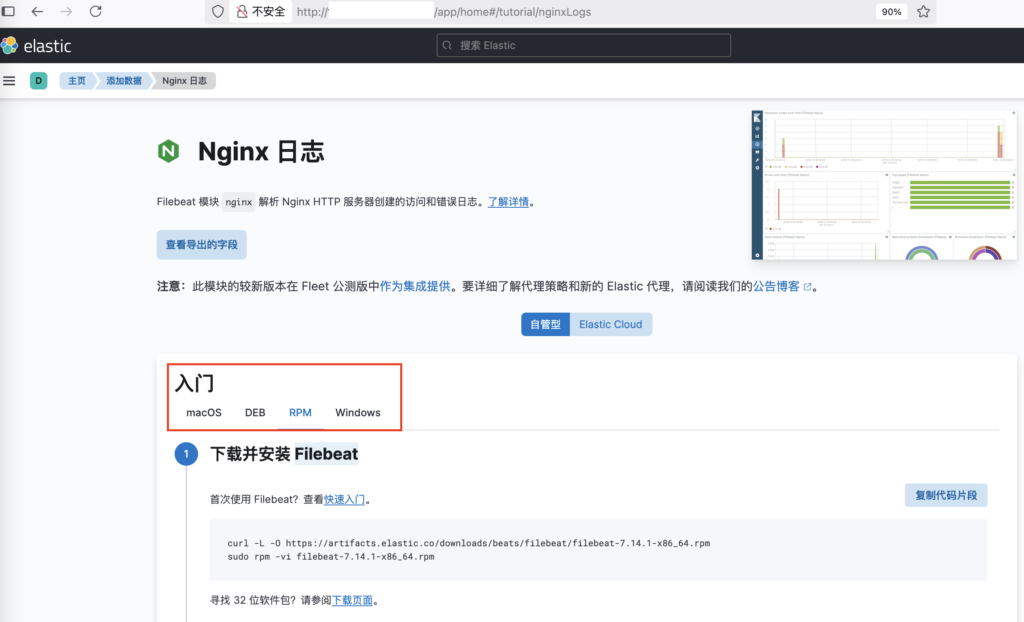
因为我们是linux centos,所以选择RPM安装。
- 下载并安装 Filebeat
curl -L -O https://artifacts.elastic.co/downloads/beats/filebeat/filebeat-7.14.1-x86_64.rpm
sudo rpm -vi filebeat-7.14.1-x86_64.rpm
- 编辑配置
修改 /etc/filebeat/filebeat.yml 以设置连接信息:
其中,<password> 是 elastic 用户的密码,<es_url> 是 Elasticsearch 的 URL,<kibana_url> 是 Kibana 的 URL。
###################### Filebeat Configuration Example #########################
# ============================== Filebeat inputs ===============================

filebeat.inputs:

- type: log

  enabled: true

  paths:
    - /mnt/nginx/logs/*.log

  #这里增加一个自定义的字段event.dataset: nginx.access,目的是让filebeat把这个log分类成nginx.access
  fields:
    event.dataset: nginx.access
  fields_under_root: true

# ============================== Filebeat modules ==============================

filebeat.config.modules:
  # Glob pattern for configuration loading
  path: ${path.config}/modules.d/*.yml

  # Set to true to enable config reloading
  reload.enabled: false

  # Period on which files under path should be checked for changes
  #reload.period: 10s

# ======================= Elasticsearch template setting =======================

setup.template.settings:
  index.number_of_shards: 1
  #index.codec: best_compression
  #_source.enabled: false

# =================================== Kibana ===================================

# Starting with Beats version 6.0.0, the dashboards are loaded via the Kibana API.
# This requires a Kibana endpoint configuration.
setup.kibana:

  # Kibana Host
  # Scheme and port can be left out and will be set to the default (http and 5601)
  # In case you specify and additional path, the scheme is required: http://localhost:5601/path
  # IPv6 addresses should always be defined as: https://[2001:db8::1]:5601
  host: "123.56.xxx.xxx:5601" ==》这里替换成kibana的IP

# ================================== Outputs ===================================

# Configure what output to use when sending the data collected by the beat.

# ---------------------------- Elasticsearch Output ----------------------------
output.elasticsearch:
  # Array of hosts to connect to.
  hosts: ["123.56.xxx.xxx:9200"] ==》这里替换成elasticsearch的IP

  # Protocol - either `http` (default) or `https`.
  #protocol: "https"

  # Authentication credentials - either API key or username/password.
  #api_key: "id:api_key"
  username: "xxxxxx" ==》这里替换成elasticsearch的实际密码
  password: "xxxxxx"  ==》这里替换成elasticsearch的实际密码

# ================================= Processors =================================
processors:
  - add_host_metadata:
      when.not.contains.tags: forwarded
  - add_cloud_metadata: ~
  - add_docker_metadata: ~
  - add_kubernetes_metadata: ~
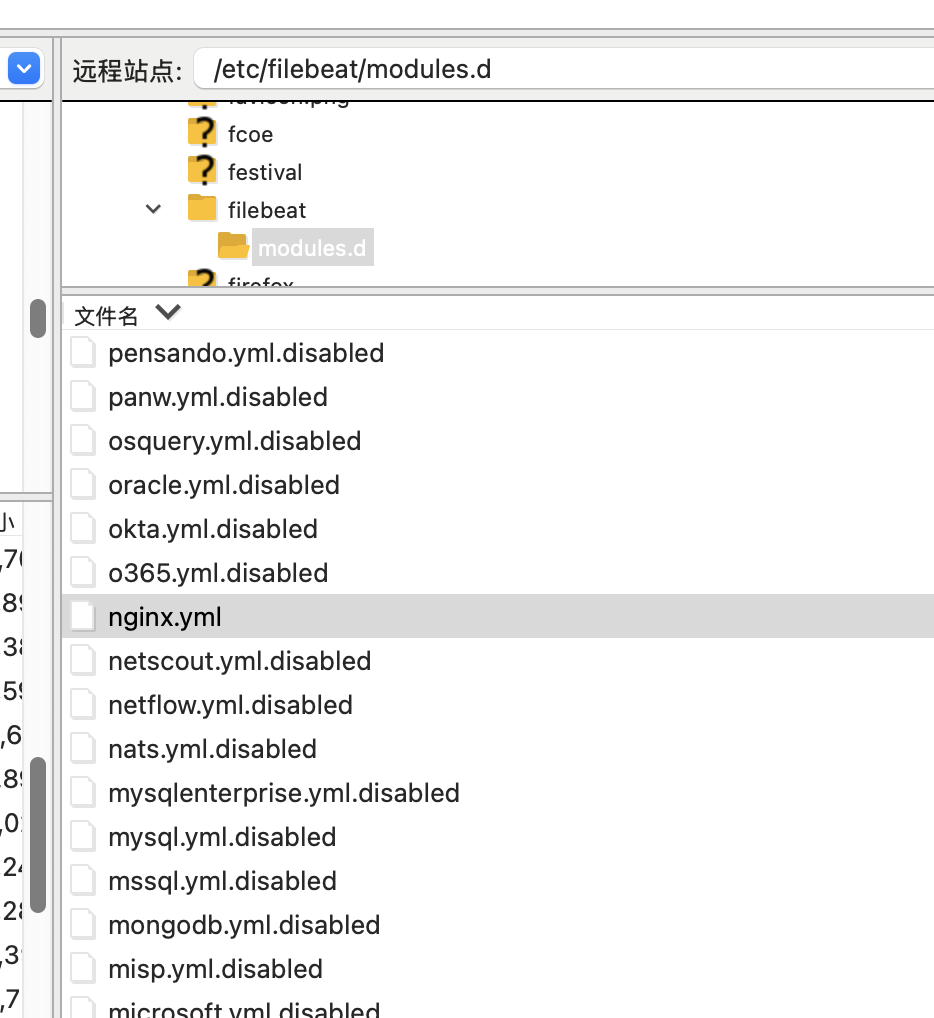
- 启用和配置 nginx 模块
sudo filebeat modules enable nginx
执行完上面的命令以后,会发现 /etc/filebeat/modules.d目录下的nginx.yml文件的disable消失了。
在 /etc/filebeat/modules.d/nginx.yml 文件中修改设置。
# Module: nginx
# Docs: https://www.elastic.co/guide/en/beats/filebeat/7.x/filebeat-module-nginx.html

- module: nginx
  # Access logs
  access:
    enabled: true

    # Set custom paths for the log files. If left empty,
    # Filebeat will choose the paths depending on your OS.
    #var.paths:
    var.paths: ["/mnt/nginx/logs/access.log"]  # Nginx 访问日志路径

  # Error logs
  error:
    enabled: true
    var.paths: ["/mnt/nginx/logs/error.log"]  # Nginx 访问日志路径

    # Set custom paths for the log files. If left empty,
    # Filebeat will choose the paths depending on your OS.
    #var.paths:

  # Ingress-nginx controller logs. This is disabled by default. It could be used in Kubernetes environments to parse ingress-nginx logs
  ingress_controller:
    enabled: false

    # Set custom paths for the log files. If left empty,
    # Filebeat will choose the paths depending on your OS.
    #var.paths:
- ngnix 设定log 格式
修改 /mnt/nginx/conf.d/default.conf
    server {
        listen 8081 ssl;
        server_name 92it.top www.92it.top;  # 同时支持两种域名访问

        # 允许最大上传文件大小为 100MB
        client_max_body_size 100M;
        client_body_buffer_size 256k;

        # 代理超时配置
        proxy_connect_timeout 120s;  # 连接后端服务器的超时时间
        proxy_send_timeout 300s;     # 向后端服务器发送请求的超时时间
        proxy_read_timeout 600s;     # 从后端服务器读取响应的超时时间(关键参数)

        # SSL 证书配置
        ssl_certificate /etc/nginx/certs/ssl-cert.pem;
        ssl_certificate_key /etc/nginx/certs/ssl-cert.key;

        # 转发所有请求到目标主机
        location / {
            proxy_pass http://123.56.xxx.xxx:30080;
            proxy_set_header Host $host;
            proxy_set_header X-Real-IP $remote_addr;
            proxy_set_header X-Forwarded-For $proxy_add_x_forwarded_for;
            proxy_set_header X-Forwarded-Proto $scheme;

            # 可选:保留所有请求头部(包括非标准字段)
            proxy_pass_request_headers on;
        }
    }
- 启动 Filebeat
setup 命令加载 Kibana 仪表板。如果仪表板已设置,请省略此命令。
sudo filebeat setup
sudo service filebeat start
- 一些常用命令
# 停止filebeat
sudo service filebeat stop

# 启动filebeat
sudo service filebeat start

# 查看filebeat状况
sudo service filebeat status
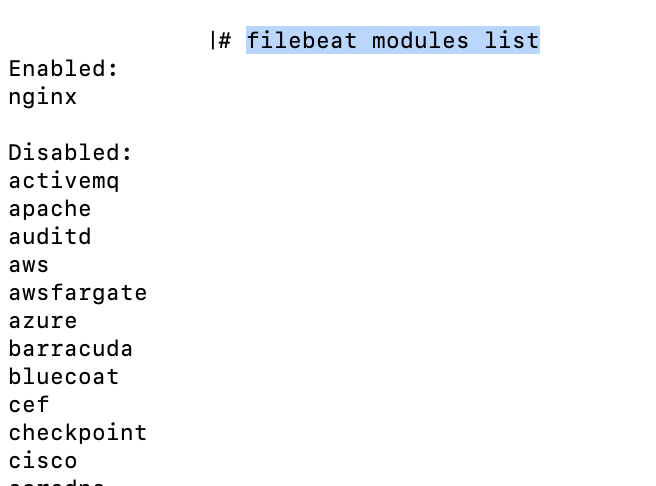
- 查看modules启动状况
filebeat modules list
- 查看日志接受状况(查询ElasticSearch的索引)
curl -X GET "http://123.56.xxx.xxx:9200/_cat/indices?v" -u "elastic用户名:elastic密码"
# 查询结果,可以看到 filebeat-7.14.1-2025.07.02-000001 有count和size了,就是推送的大小。
health status index                                     uuid                   pri rep docs.count docs.deleted store.size pri.store.size
green  open   .kibana_task_manager_7.14.1_001           MqVI48GLS32sT6K--dacyQ   1   0         15        41775      6.8mb          6.8mb
green  open   .transform-internal-007                   tmPy01jfQiq67WMqkzFIrw   1   0          3            0     25.8kb         25.8kb
green  open   .apm-agent-configuration                  xa-jMXyKTkmQ3t-KjqTahQ   1   0          0            0       208b           208b
yellow open   filebeat-7.14.1-2025.07.02-000001         FZSLXLM5RYalW8wsLq5Nnw   1   1       1100            0    621.2kb        621.2kb
green  open   .kibana_7.14.1_001                        F98UL77vSea0mFvJ5XPikA   1   0       7092           31      8.5mb          8.5mb
green  open   .tasks                                    mSIuWhWeRK-wesFeQDwqYw   1   0         14            0     71.2kb         71.2kb
green  open   metrics-endpoint.metadata_current_default m9Jm8nFgSfGlCGtazOfYCw   1   0          0            0       208b           208b
green  open   .geoip_databases                          jPn-7jWHT4qft9WYg0rFhA   1   0         40           35       38mb           38mb
green  open   .security-7                               _eK2IBYnTAGjlIN61kc4aQ   1   0         55            0      304kb          304kb
green  open   .apm-custom-link                          5Sv50RrFRoKKqvpetIg8bQ   1   0          0            0       208b           208b
green  open   kibana_sample_data_ecommerce              mHI93EdLTGigIF8RfdvVOg   1   0       4675            0      3.6mb          3.6mb
green  open   .async-search                             vBMXYUsSRvO4saUbIJay-Q   1   0        180           19    676.7kb        676.7kb
green  open   .fleet-policies-7                         HiD5YQerSIipdHgiktIhxg   1   0          5            0     31.8kb         31.8kb
green  open   .kibana-event-log-7.14.1-000001           aOqC-lFVQdGvGS_9xHSYBQ   1   0          8            0     43.4kb         43.4kb
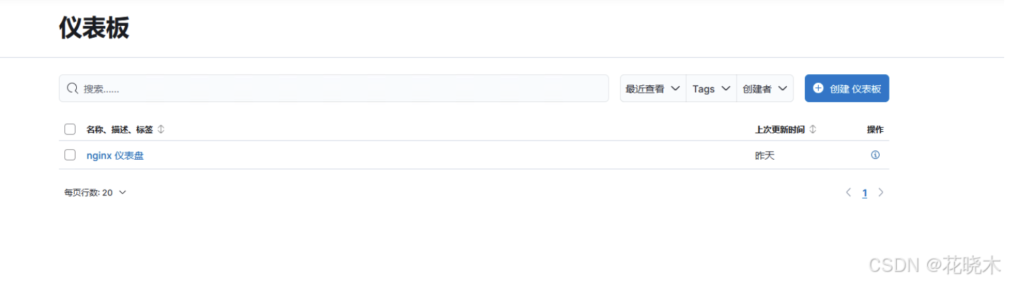
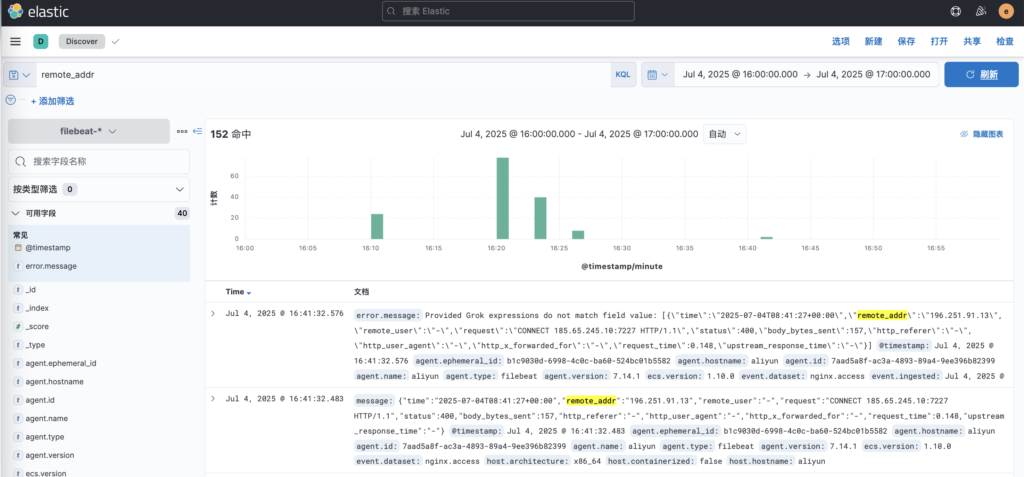
在 Kibana dashboard查看ngnix log
- 如果
filebeat没问题的话,可以在Kibana dashboard看到采集到的ngnix log。
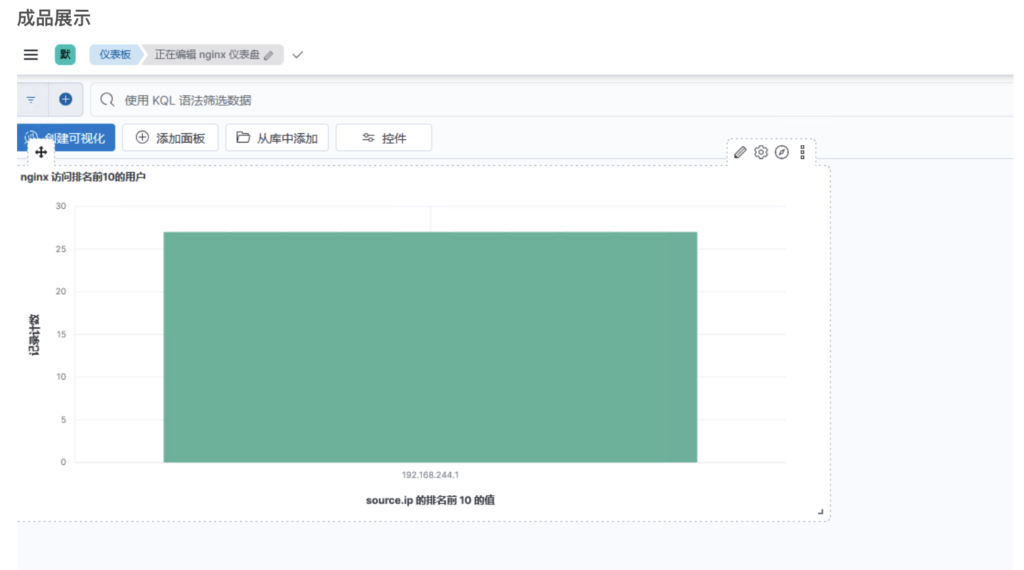
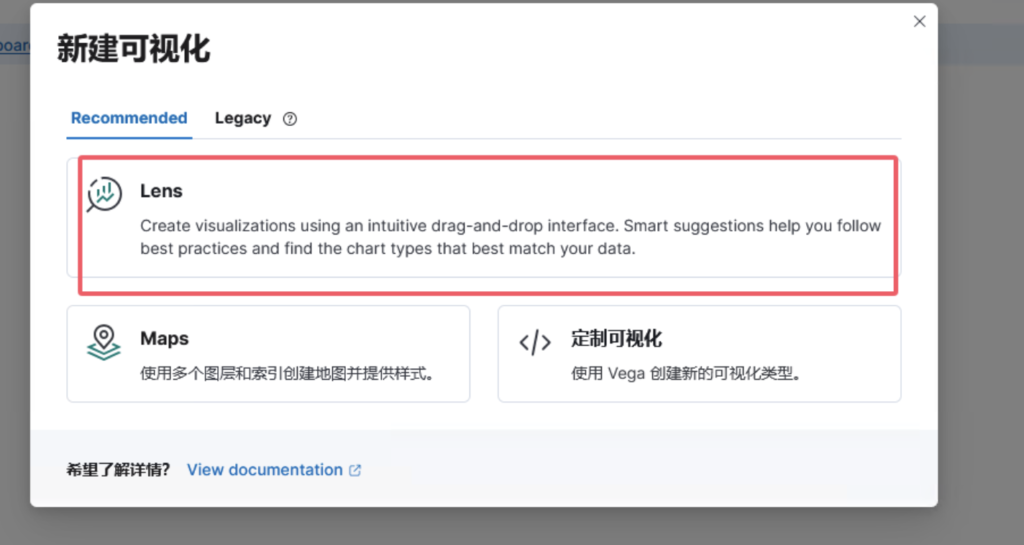
- 创建可视化
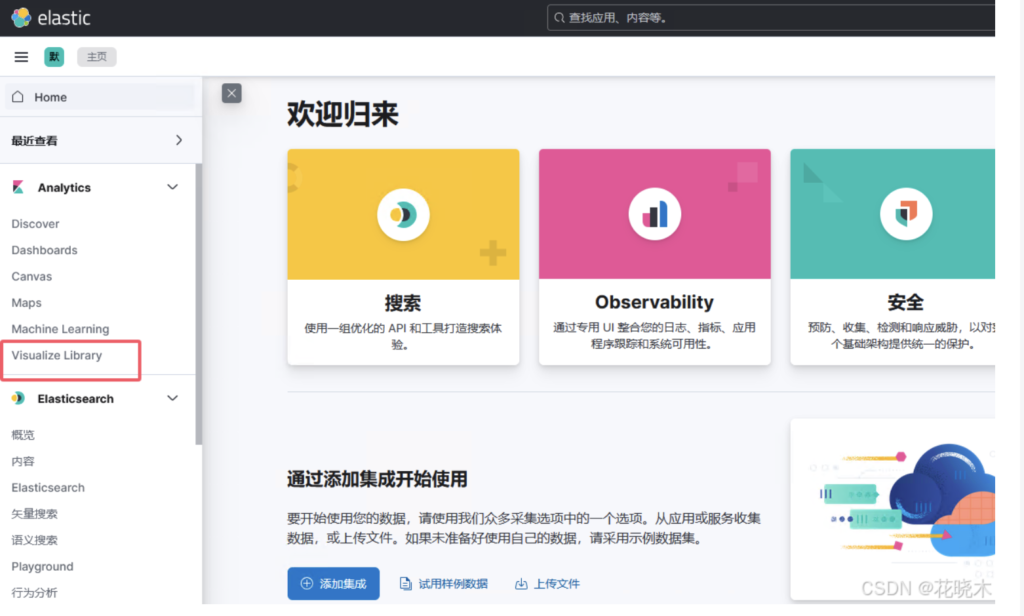
- 进去之后 —》 点击 新建可视化 —》点击 Lens
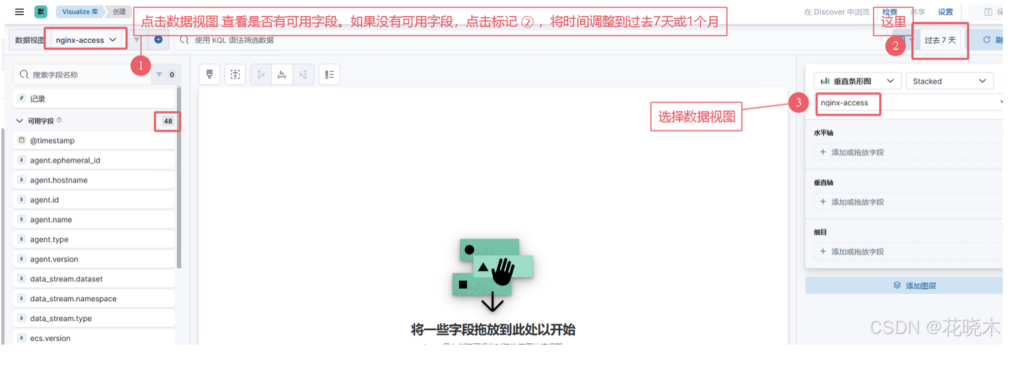
- 准备创建条形图
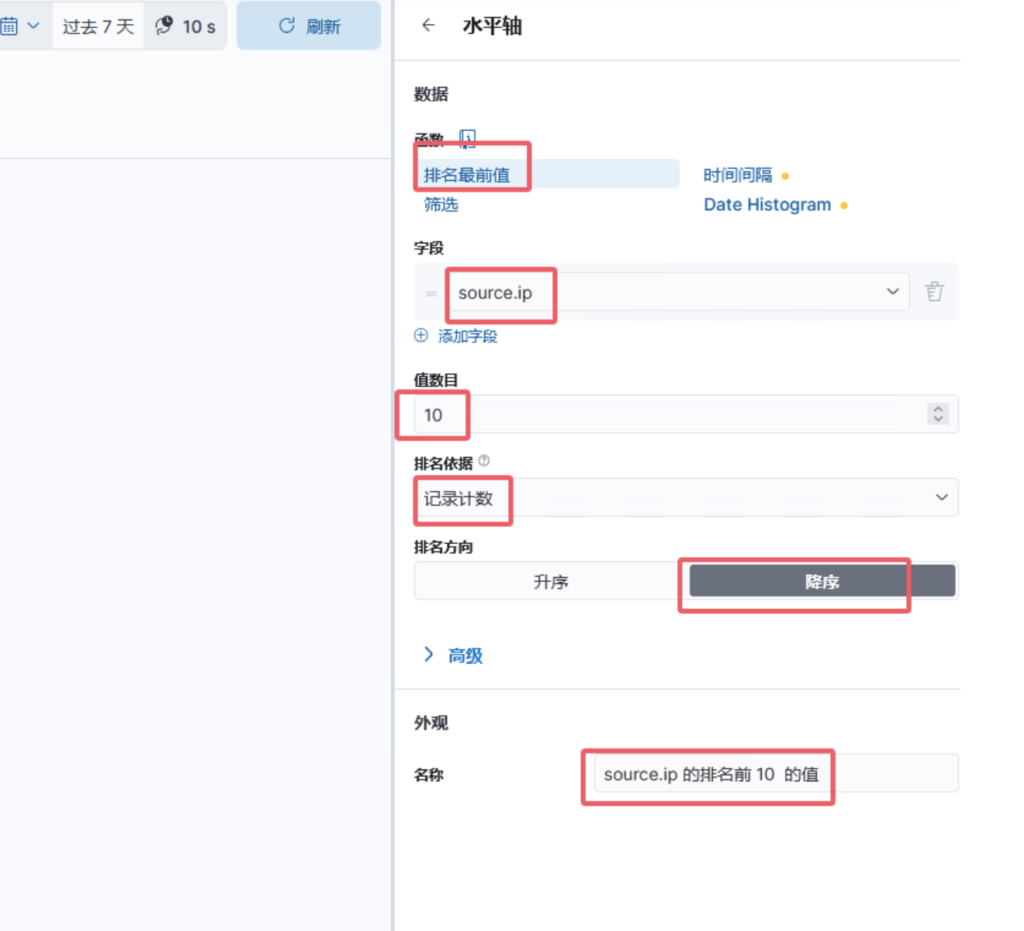
- 点击 水平轴 配置如下
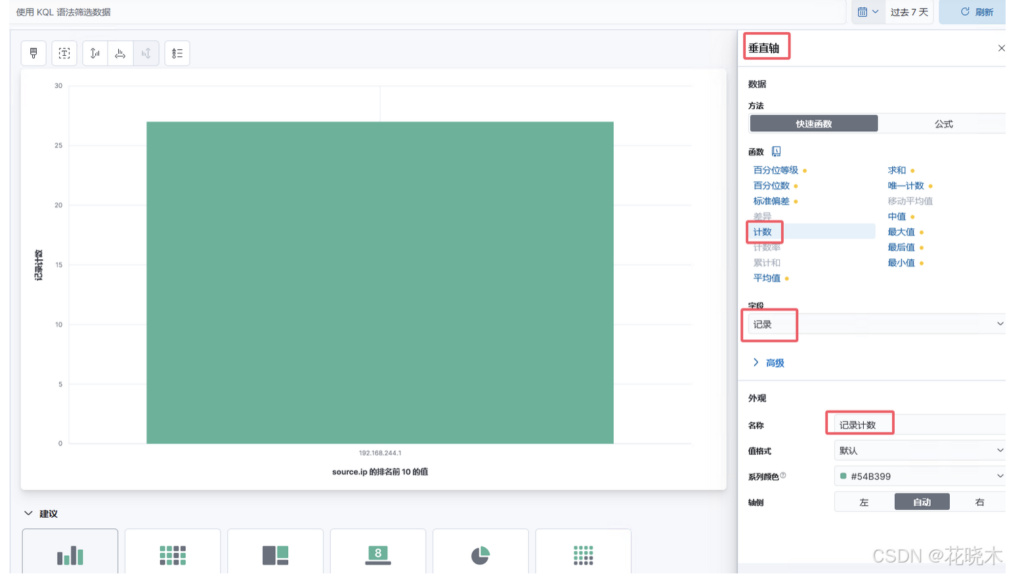
- 点击 垂直轴
- 点击右上角的保存即可。最后查看仪表,点击 kibana —》 Dashboards